Posts

Showing posts from December, 2020

Why "SHOOTING STAR" got failed?

Image
  Trading is not all about patterns/technical or fundamental analysis. Why? Most of the times  it will be easy or maybe sometimes it will be complicated Anyhow, if you really want to be a great trader or investor, you need an observation. Again saying that you don't want to have the highest IQ or more of intelligence, all you need is simple logic or common sense. Coming to the point if you start observing the above chart, its clear cut selling from higher levels. Technical evidence is there as a shooting star plus followup selling pressure was exist. But the stock did not go down as the bookish concepts. Now if we start to observe the candlesticks, we may come to know what's happening to the particular stock I have marked the zone(downside wick potion), this is now a very crucial and interesting part to understanding the battle between bulls and bears. Exactly sellers are trying to sell, they are doing their job, but buyers are very strong and they are defending the sellers in...
The inner meaning of the "DOUBLE BOTTOM"

Image
  What is the inner meaning of the double bottom? Whenever a stock comes to the support we look for buying opportunities. Here I am trying to explain the concept behind the double bottom. You have to be open-minded about the context, focus on the price instead of a pattern. If you observe the price alone, the stock started falling from the level “R”, i.e. said to be resistant. Now you need to find good support to buy. If you observe the price @ “1”, the stock is halting and taking a sort of up move called pullback. But we won't consider it as strong support. Why? Whenever the stock or market is falling we need strong evidence, to trade against the primary trend. Why should I not try to buy @ level “1”? The reason is so simple, whenever sellers start selling from higher levels, after some correction they might recover the stocks at a cheaper price, that might be the reason to first-time bounce. And the second reason is logic: when the first bounce is happening retailers will come to...

Where sellers are waiting?

Image
  How to know where the sellers zone? Once of the best areas or zones to watch, where price is struggling to move upside and take the “U” turn. This is generally referred to be supply/resistance/sellers zone. All we need is to draw the zone of the left side wick and extend the zone to the right side. Now the extended zone can be considered as a supply zone. When the stock approaches this level, chances are sellers to get activated. In the above fig, if the wick was created by sellers, now we need to draw the entire wick and extend the zone to the right side. Sellers are getting activated, whenever the stock approaches the supply zone. Now all need a simple observation from the candlestick. There are multiple bearish engulfing candlestick formations. It’s clearly saying that the sellers are very strong. Now we can sell below the bearish engulfing candle, now the stop loss needs to keep above the supply zone. *Keeping stop loss is tricky, as the market approaches this resistance zone...

False Breakouts

Image
  We can find several false breakouts at any time frames. Once you start observing the price action, you come to know that which one is the real breakout/breakdown. In the above figure: if you observe the resistance levels closely, we can expect some selling pressure at resistance levels, but what happened? There is no selling force when the market is reaching the resistance levels. And the bulls can break out upside without any major struggle. This means, buyers are very strong and sellers are giving up. But if you observe the price alone, you will come to the conclusion that buyers' force is strong. But the next immediate day sellers get activated and show their power. Now we have 2 choices 1.If a trader wants to be a buyer, he or she needs to wait for the price to close above the quick reversal candle. 2.Trader can take the short below the quick reversal candle, by keeping the stop loss above the quick reversal candle. Enable Ginger Cannot connect to Ginger Check your internet ...

NIFTY LEVELS 13050 - 13200

Image
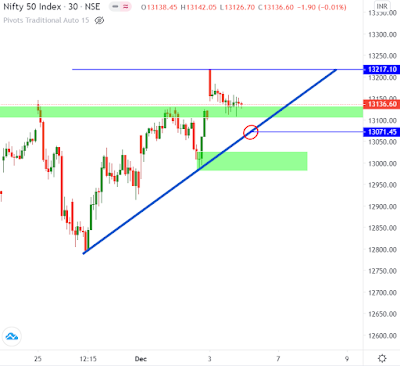
  NIFTY  Nifty is facing resistance at 13217, NIFTY may be joining into distribution Zone. Now we need to buy in dips and sell on rising. We have seen some sort of profit booking at higher levels. We have trendline support, Nifty may test this level. keep an eye 13050 odd level. NIFTY 13200 RESISTANCE NIFTY 13050 SUPPORT Enable Ginger Cannot connect to Ginger Check your internet connection or reload the browser Disable in this text field Edit Edit in Ginger Edit in Ginger × Enable Ginger Cannot connect to Ginger Check your internet connection or reload the browser Disable in this text field Edit Edit in Ginger Edit in Ginger ×

Trading is an art

HOW TO BE ON THE RIGHT SIDE? Trading means simply buying or selling shares, futures, or options. But there are different mindsets of people across the world. So how each one of them looks at the market movements? This is the point where we need to think to gauze the market sentiments. There are two type of personalities into the market participants 1.Trend fallower 2.Counter trend traders (traders against the trend) According to the research reports: Most of the money is making by trend followers, comparatively with Countertrend traders. What does it mean? Once trend was established, it takes a longer time to get reversed. New or inexperienced traders have fear of falling at higher prices and greed of reverse at lower prices. This fear is the advantage for big institutions, they will keep on pushing the prices to higher levels, Counter trend traders keep on shorting when the market is rising. So exactly why are they shorting the rising markets? there are multiple reasons to explain thi...

Retailers

 Why market goes against traders? Trading is a ZERO sum game, so if someone is making money means, others are losing. So institutions, hedge fund managers, FII's & DII's and even you & I all against each other. But in the trading game all we will have plans and technical analysis, indicators, opinions and emotions... etc. In this game who ever having huge capital is said to be a big player or simply institution. They want to make big money, so they need losers. Obviously retailers will be the losers. Why retailers lose the money? They come up with little capital, they used to take leverage, So big players can easily  shake out them and hunt their stop loses every time. Institutions can create panic/pressure by creating "oscillation/swings" in the markets. So whoever having positions they will exit if markets against them. Even if they have the tendency to fight against the "MARKETS", they can't bare huge loses. Because "the market is so big...