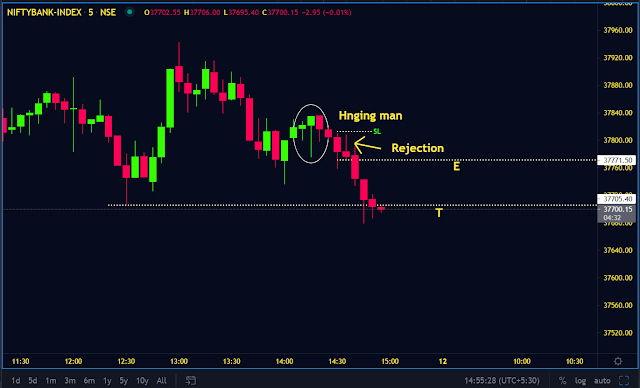
False Breakouts
We can find several false breakouts at any time frames.
Once you start observing the price action, you come to know that which one is the real breakout/breakdown.
In the above figure: if you observe the resistance levels closely, we can expect some selling pressure at resistance levels, but what happened?
There is no selling force when the market is reaching the resistance levels.
And the bulls can break out upside without any major struggle.
This means, buyers are very strong and sellers are giving up.
But if you observe the price alone, you will come to the conclusion that buyers' force is strong. But the next immediate day sellers get activated and show their power.
Now we have 2 choices
1.If a trader wants to be a buyer, he or she needs to wait for the price to close above the quick reversal candle.
2.Trader can take the short below the quick reversal candle, by keeping the stop loss above the quick reversal candle.
