Posts

AMARA RAJA BATTERIES (long term bet)

Image
   One can accumulate in dips till 520 odd levels. Down trend consolidation (above 6 months ) period is about to end, any moment it can be in lime spot.

4 Emotions

• Hope: I sure hope this goes up right after I buy it. • Fear: I can’t take another loss; I’ll sit this one out. • Greed: I’m making so much money, I’m going to double my position. • Despair: This trading system doesn’t work; I keep losing money.

PAYTM (stock)

Image
 

Why "SHOOTING STAR" got failed?

Image
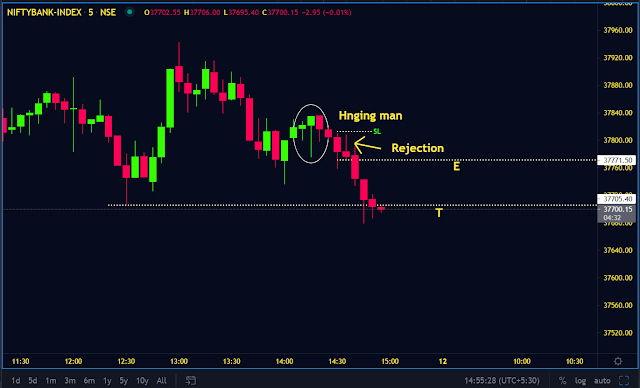
  Trading is not all about patterns/technical or fundamental analysis. Why? Most of the times  it will be easy or maybe sometimes it will be complicated Anyhow, if you really want to be a great trader or investor, you need an observation. Again saying that you don't want to have the highest IQ or more of intelligence, all you need is simple logic or common sense. Coming to the point if you start observing the above chart, its clear cut selling from higher levels. Technical evidence is there as a shooting star plus followup selling pressure was exist. But the stock did not go down as the bookish concepts. Now if we start to observe the candlesticks, we may come to know what's happening to the particular stock I have marked the zone(downside wick potion), this is now a very crucial and interesting part to understanding the battle between bulls and bears. Exactly sellers are trying to sell, they are doing their job, but buyers are very strong and they are defending the sellers in

The inner meaning of the "DOUBLE BOTTOM"

Image
  What is the inner meaning of the double bottom? Whenever a stock comes to the support we look for buying opportunities. Here I am trying to explain the concept behind the double bottom. You have to be open-minded about the context, focus on the price instead of a pattern. If you observe the price alone, the stock started falling from the level “R”, i.e. said to be resistant. Now you need to find good support to buy. If you observe the price @ “1”, the stock is halting and taking a sort of up move called pullback. But we won't consider it as strong support. Why? Whenever the stock or market is falling we need strong evidence, to trade against the primary trend. Why should I not try to buy @ level “1”? The reason is so simple, whenever sellers start selling from higher levels, after some correction they might recover the stocks at a cheaper price, that might be the reason to first-time bounce. And the second reason is logic: when the first bounce is happening retailers will come to

Where sellers are waiting?

Image
  How to know where the sellers zone? Once of the best areas or zones to watch, where price is struggling to move upside and take the “U” turn. This is generally referred to be supply/resistance/sellers zone. All we need is to draw the zone of the left side wick and extend the zone to the right side. Now the extended zone can be considered as a supply zone. When the stock approaches this level, chances are sellers to get activated. In the above fig, if the wick was created by sellers, now we need to draw the entire wick and extend the zone to the right side. Sellers are getting activated, whenever the stock approaches the supply zone. Now all need a simple observation from the candlestick. There are multiple bearish engulfing candlestick formations. It’s clearly saying that the sellers are very strong. Now we can sell below the bearish engulfing candle, now the stop loss needs to keep above the supply zone. *Keeping stop loss is tricky, as the market approaches this resistance zone, it